The Analytics feature allows you to track your radio station’s listener statistics. This is helpful for determining which of your shows are most popular and which time slots attract the most listeners.

The number of current listeners is displayed in the Airtime interface at the top-right corner beside the ON AIR sign.

You can access more detailed listener information from the Airtime main menu on the left. Click on the Analytics tab and select Listener Stats to view listener statistics for categories like region, time, show popularity, etc. In addition to in-depth listener data, the Analytics section also provides access to records of all the tracks that have aired on your radio station in the Playout History section. Read the Playout History section of the Airtime User manual for detailed information on that section.

You can access listener statistics categories via the links at the top of the listener statistics page or by scrolling down the page.
The default date range for filtering statistics is set to one week. You can adjust the time span for the current listener stats by clicking on the calendar icons and changing the dates. When the dates are set to your liking, click the Filter Stats button to refresh the displayed stats so they reflect the current date range. Clicking the Previous Week button will revert to the default date range of one week. It is possible to go back many weeks by clicking the Previous Week button multiple times.
Regional Stats

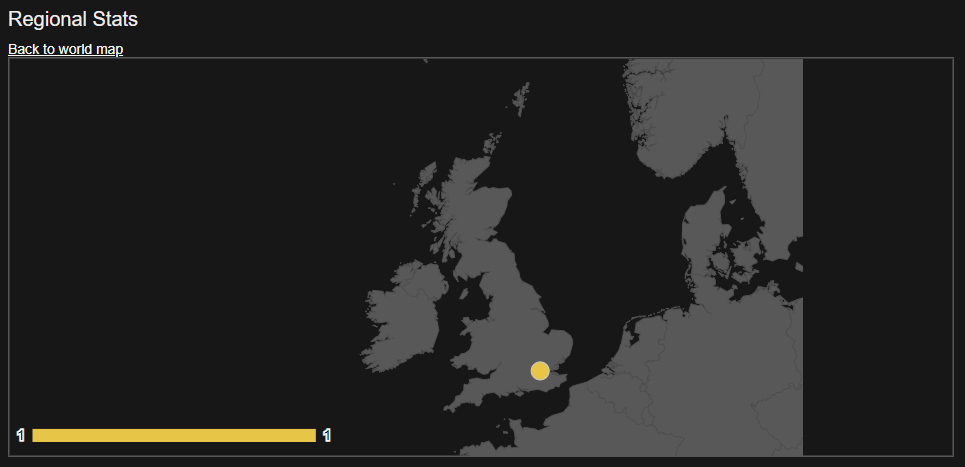
The Regional Stats section shows a world map with countries highlighted in yellow containing listener sessions. A listener session is a period in which a user connects to your Airtime stream. A single person can create multiple listener sessions by disconnecting and reconnecting at different times. Below the world map is a list of countries and the exact number of listener sessions generated in each.

Clicking on a country on the world map will allow for a more detailed view of the country and areas in from which your station is being streamed within that country. In the example above, I clicked on England and I can see the one listener there is from London. Click on the Back to World Map link above the map to return to the full world view.
Aggregate Listener Hours

The Aggregate listener hours section monitors the total number of hours over a 24-hour period in which people were listening to your Airtime station. It adds up the total number of hours per day from all listeners over the past week and displays it in a graph.
By default, the span of the graphs is set to one week. You can adjust this length of time by using the date boxes at the top of the page and clicking the Filter Stats button. This will update all the graphs and information displayed in the Listener Stats section. Below the graph is a grand total of aggregate listener hours.
Most Popular Shows
The Most Popular Shows section displays the names and time slots of the radio shows which attracted the most listener sessions within the selected time span. The details display the name of the radio show as well at the start time, end time and number of listener sessions.

Listener Count and Streams
With Airtime Pro, your radio station can have multiple streams. These are set up in your Settings tab, under Streams. Having multiple streams allows you to broadcast in different formats and at different bitrates. Many stations opt to offer a low bitrate option for users with slower internet connections. You can see how many user sessions have occurred across multiple days in the Listener Count section. If you have multiple streams set up, the listener counts will also be coded to show which stream your listeners were connecting to.

The Listener Stats section also provides data on the Monthly Listener Bandwidth Usage. This feature tracks how much bandwidth your listeners are using. The more listeners you have, the more bandwidth you will use.

Your allotted bandwidth resets monthly on your renewal date. This section will also tell you how much bandwidth you’re using as a percentage of your total allotted bandwidth.
Session Duration Distribution
The last section in the Listener Stats page is a Session Duration Distribution. This displays how long users leave a stream open when they listen to your radio station. Longer session times mean more engaged listeners.

0 Comments